

Archive

5 Signs Your Website is Costing You Leads

5 signs website costing leads, confusing navigation visual

Key Takeaways

  • An unclear hero section loses visitors in the first three seconds — lead with a benefit-driven headline and one CTA.
  • Too many competing calls-to-action paralyze decision-making — prioritize one action per page.
  • A poor mobile experience silently drops conversions on more than half your traffic – test on real devices.
  • Over-long inquiry forms create friction before you’ve earned the right to ask — keep it to the essentials.
  • Slow load speeds hurt both conversions and search rankings — aim for an LCP under 2.5 seconds.

If your website gets 10,000 visitors a month and converts at 1%, that’s 100 leads. Drop the conversion rate by half a percentage point — the kind of quiet decline a design problem can cause without anyone noticing — and you’ve just lost 50 leads. Every month. Forever, until it’s fixed.

That’s the uncomfortable math of website UX. Poor design doesn’t announce itself with an error message or a broken link. It shows up as a slow, invisible bleed of prospects who were interested enough to click, then left before they got in touch.

The reasons are rarely mysterious. Imagine a trade show booth with no signage explaining what the company does, three reps all pitching different services at once, and a clipboard demanding your budget before anyone has shaken your hand. You’d walk past. Most websites are that booth, and most visitors are walking past for exactly these reasons.

Here are five red flags worth auditing on your own site, how to fix each one, and how to measure whether the fix is working.

1. Your hero section doesn’t answer “what do you do?” in three seconds

If a visitor lands on your homepage and can’t immediately understand who you are and what you offer, they’re gone. Vague taglines like “Empowering Your Tomorrow” might sound polished, but they do nothing to convert.

  • Fix it: Lead with a clear, benefit-led headline, a one-line sub-header, and a single call-to-action. No carousel. No auto-play video. Clarity beats cleverness.
  • Measure it: Track bounce rate on your homepage via GA4. A rate above 60–65% is a signal your opening message isn’t landing.

2. You have too many calls-to-action

When everything is a priority, nothing is. Multiple competing CTAs like Book a Call, Download Our Guide, View Our Work, Sign Up, or Learn More paralyze visitors rather than guide them.

  • Fix it: Identify the single most valuable action you want a visitor to take on each page, and design around that. Secondary actions should be visually subordinate.
  • Measure it: Use heatmapping tools (Hotjar, Microsoft Clarity) to see which CTAs are being clicked and which are being ignored entirely.

3. Your mobile experience is an afterthought

Over half of web traffic is mobile. If your site requires pinching, horizontal scrolling, or tapping buttons the size of a grain of rice, you’re losing leads on many of your visitors.

  • Fix it: Test every key page on a real phone, not just a browser preview. Prioritize tap-target sizing (minimum 44px), readable font sizes, and forms that don’t require desktop-level precision.
  • Measure it: In GA4, segment conversions by device type. A significant drop-off on mobile versus desktop tells you exactly where to focus.

4. Your contact or inquiry form has too many fields

Every additional field in a form reduces the likelihood of it being completed. Asking for company size, budget range, and how they heard about you before you’ve even had a conversation is friction masquerading as data collection.

  • Fix it: Reduce your form to the bare minimum needed to start a conversation. This is typically name, email, and one open field. Gather the rest once they’re a lead.
  • Measure it: Monitor form completion rate. If people are landing on your contact page but not submitting, the form itself is the barrier.

5. Slow load times are silently killing conversions

The math is unforgiving. Portent’s analysis of 27,000+ landing pages found B2B conversion rates roughly 3x higher on sites that load in 1 second versus 5 seconds, and 5x higher versus sites that load in 10 seconds. Heavy images, unoptimized code, and too many third-party scripts compound quickly, and Google’s ranking algorithm penalizes slow sites on top of it.

  • Fix it: Run your site through Google PageSpeed Insights or GTmetrix. Compress images, defer non-critical scripts, and consider whether every plugin or tracking tag is truly earning its place.
  • Measure it: Monitor Core Web Vitals in Google Search Console. Aim for a Largest Contentful Paint (LCP) under 2.5 seconds.

Your website should be your hardest-working salesperson. If any of these five signs sound familiar, you’re not dealing with a traffic problem, you’re dealing with a conversion problem. And the good news is, conversion problems are fixable.


About the author

Neil Fraser leads digital strategy at STIR, helping clients translate brand positioning into websites and digital experiences that actually convert. He works across discovery, UX, and delivery, focussing on the details that quietly determine whether a site earns its keep.
How to Measure PR Impact Beyond Impressions

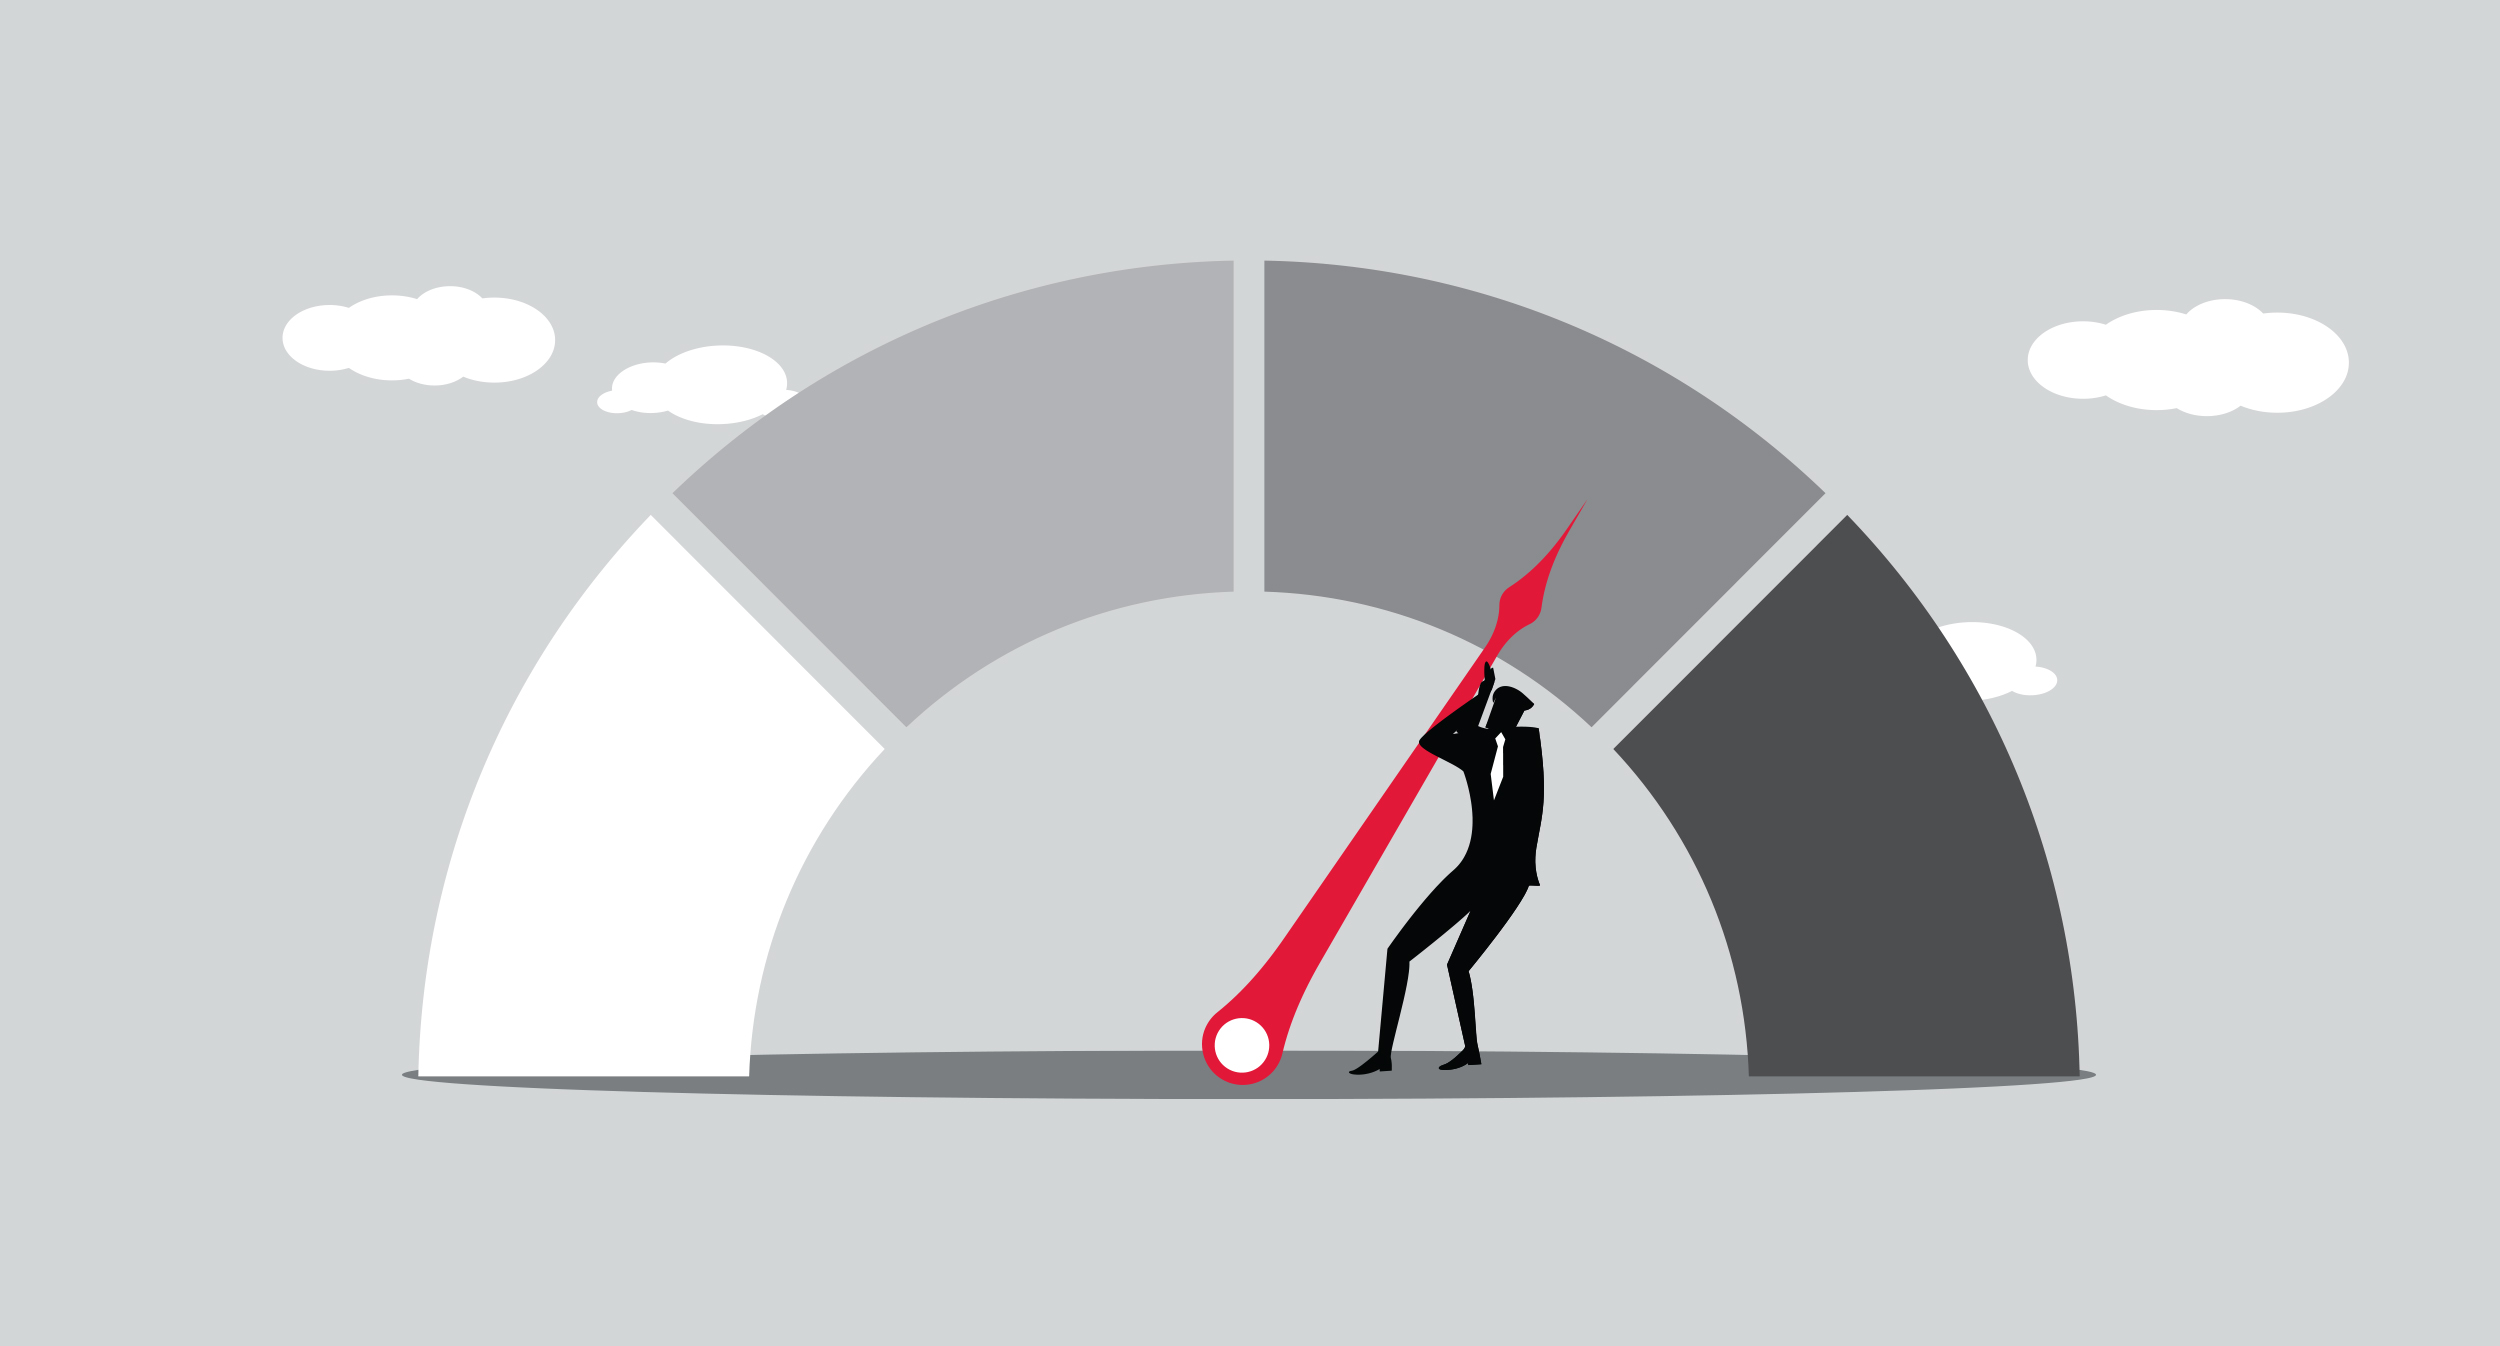
measuring pr impact beyond impressions, visual of man moving a dial upwards

Key Takeaways

  • Impressions are widely used for good reason — they’re trackable, comparable, and easy to communicate. They’re the floor of PR measurement, not the ceiling.
  • Share of voice and sentiment analysis are a key next step, and most teams already have access to both via their existing monitoring tools.
  • AI visibility is an early-stage metric worth watching as zero-click search reshapes how key messages reach audiences.
  • AVE remains a useful communication tool when treated as one data point in a broader picture, not the headline number.
  • The best PR measurement programs build on what’s working, adding one or two metrics that connect activity to outcomes — not overhauling everything at once.

Reach is a legitimate starting point. The question is what comes next.

Impressions have long been the backbone of PR measurement, and for good reason. But in 2026, reach alone is only part of the story. Leadership teams are asking harder questions: Did this coverage change how people think about us? Did it influence a purchase decision? PR measurement has more tiers than impressions, and the opportunity is to build up from where you are. This post walks through what forward-looking PR programs are adding to the measurement mix, and why you don’t have to overhaul everything to get there.

Impressions are the floor, not the ceiling

According to Meltwater’s 2026 State of PR Report, volume of media placements and reach/impressions remain the top metrics teams use to evaluate success. The opportunity isn’t to replace impression-based reporting — it’s to build on top of it with metrics that speak to outcomes, not just outputs.

STIR’s measurement stack

At STIR, we think about PR measurement as a three-tier stack. Most programs are solid at Outputs, which is a legitimate foundation. The opportunity is adding one or two metrics from the tiers below.

  • Outputs: Coverage volume, placements, reach, impressions, AVE. What most teams already track.
  • Outcomes: Shifts in audience sentiment, perception, or behavior. The “did it work?” layer.
  • Impact: Effects on lead quality, pipeline, and sales. The seat-at-the-table layer.

A note on Ad Value Equivalency

AVE remains one of the most debated metrics in PR, and one of the most requested. It has real limitations: earned coverage carries credibility that paid placement can’t replicate, and AVE doesn’t account for sentiment or audience fit. That said, it still serves a practical purpose when communicating PR’s value to leadership teams who think in advertising budgets. We treat it as one data point in a broader picture, not the headline number.

Share of voice and sentiment are the easiest next steps

If you’re already using a monitoring platform, you likely have access to both share of voice and sentiment analysis without adding new tools. Share of voice tells you how much of the relevant conversation you’re owning, not just how much coverage you’re getting. Sentiment goes a layer deeper: are those mentions building credibility or just generating noise? Together, they answer the question impressions can’t: Is the coverage actually working?

AI visibility is an early-stage metric worth watching

Generative Engine Optimization (GEO) tracks whether your brand shows up accurately in AI-generated answers from platforms like Claude, Google Gemini, and Microsoft Copilot. Research consistently shows more than half of searches now end without a click, which means your key messages need to work harder upfront. A useful starting point: run your brand’s key category questions through a few AI platforms quarterly and document what you find. It takes about 20 minutes and costs nothing.

What’s the right next step for your program?

Keep what’s working, then add one or two metrics that connect PR activity to something leadership cares about. Three low-friction places to start:

  1. Add share of voice to your monthly report — it typically takes less than an hour to set up.
  2. Track sentiment trends over time, even at a high level (positive / neutral / negative by quarter).
  3. Do a quarterly AI spot-check: search your brand’s key category questions in Gemini or ChatGPT and document what comes back.

At STIR, we help brands build measurement frameworks that start where you are and grow toward the outcomes that matter most. Because the best PR story isn’t just how many people saw your message — it’s what happened after they did.


Strategy that can’t be executed is theatre. Execution that isn’t measured is theatre too, just better-dressed. The work is making sure what we report on actually reflects what we did — and what it delivered.

Ready to think about what to add to your measurement mix? Let’s talk.


About the author

Christel Henke is VP Earned Media at STIR Advertising. She has more than 35 years of experience in communications strategy and PR measurement. At STIR, she helps brands build measurement frameworks that start where they are and grow toward what leadership actually cares about.